Trend trading is a strategic approach
Stock Trend Trading Basics
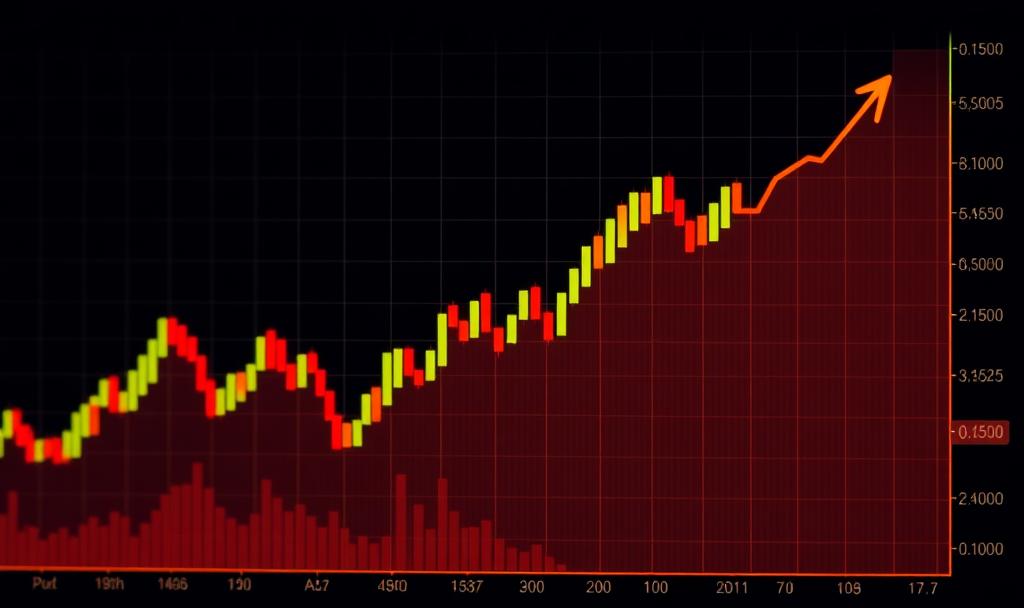
Trend trading is a strategic approach to financial markets that involves identifying and following established price movements to capitalize on directional momentum, with traders relying on technical indicators such as moving averages, MACD, and RSI to confirm trends and optimize entry and exit points.
Understanding Trend Fundamentals
Successful trend trading hinges on recognizing three fundamental trend types: uptrends (characterized by higher highs and higher lows), downtrends (showing lower highs and lower lows), and sideways trends (where prices oscillate within a horizontal range). 1 2 The cornerstone philosophy—”the trend is your friend”—suggests that established trends typically continue rather than reverse until clear reversal signals emerge. 3 4
To effectively identify trends, traders analyze price charts for consistent patterns, draw trendlines to visualize direction and strength, and employ technical analysis to confirm momentum. 5 6 This methodical approach allows traders to capitalize on sustained price movements while avoiding the pitfalls of market noise and short-term fluctuations. 8 The strategy’s popularity stems from its simplicity, minimal time requirement, and consistent historical performance record across various markets including stocks, forex, and commodities.
Essential Technical Indicators
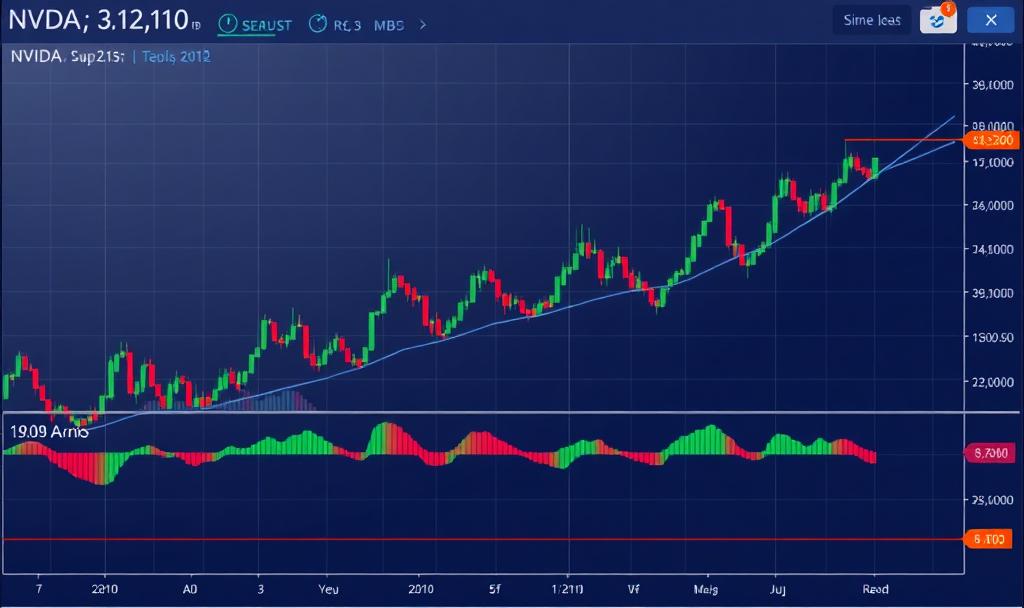
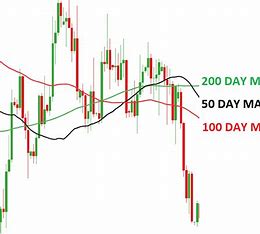
Moving averages stand as the cornerstone of trend trading, filtering market noise and signaling reversals through crossovers between different timeframes (such as the 50-day vs. 200-day). I The MACD (Moving Average Convergence Divergence) offers dual insights by revealing both direction and underlying momentum in a single indicator, with divergence between MACD and price often warning of potential trend
For comprehensive trend analysis, traders typically employ additional specialized tools: the Average Directional Index (ADX) measures trend strength regardless of direction; Bollinger Bands track volatility and potential breakouts; the Parabolic SAR provides clear visual cues for exits and reversals; and On-Balance Volume (OBV) confirms price trends through volume analysis. 2 3 Most successful trend traders combine multiple indicators rather than relying on any single tool, creating a system that filters false signals while improving trend identification and trade timing.
Successful trend traders employ several distinct approaches to enter and exit positions. Breakout trading involves entering when price breaks above resistance or below support, signaling the start of a new trend. Alternatively, pullback or retracement trading focuses on entering after temporary reversals within established trends, aiming to capture the next move in the primary trend direction. Moving average crossovers provide another systematic approach, with traders buying when short-term averages cross above long-term ones and selling when the opposite occurs.
When applying these strategies to specific stocks, traders must first analyze the current price action and technical indicators. For instance, when considering a stock like Apple (AAPL), a trend trader would examine whether the price sits above or below key moving averages, identify clear support and resistance levels, and wait for optimal entry conditions rather than chasing short-term price movements. 5 6 This patient, disciplined approach—waiting for clear trend confirmation before entering and being ready to exit when trends show reversal signs— forms the foundation of consistent trend trading success.
Effective risk management
Effective risk management forms the backbone of successful trend trading, with stop-loss orders serving as the primary defense mechanism. These orders should be strategically placed below support levels during uptrends or above resistance in downtrends to limit potential losses when trends reverse unexpectedly. Position sizing represents another crucial component, Management with experienced traders typically risking Process only a small percentage of their capital on factors linkedin.com any single trade.
The psychology behind trend trading also plays a vital role in risk management. Traders must maintain discipline and patience, avoiding the temptation to chase short-term price movements or abandon their strategy during temporary market fluctuations. Continuous learning through practice with demo accounts and backtesting strategies before committing real capital helps refine risk parameters and build confidence in the trading approach. 5 This balanced combination of technical risk controls and psychological discipline creates a sustainable framework for capturing profits from trending markets while protecting capital during inevitable reversals.


Leave a Reply